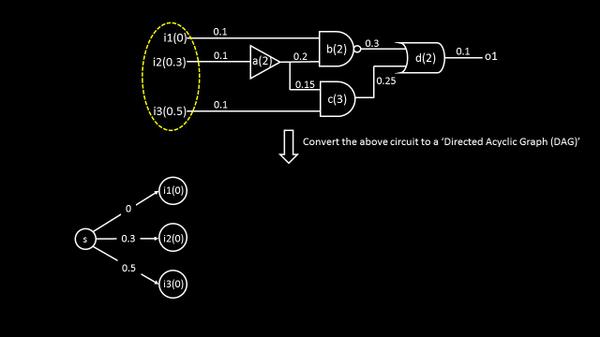
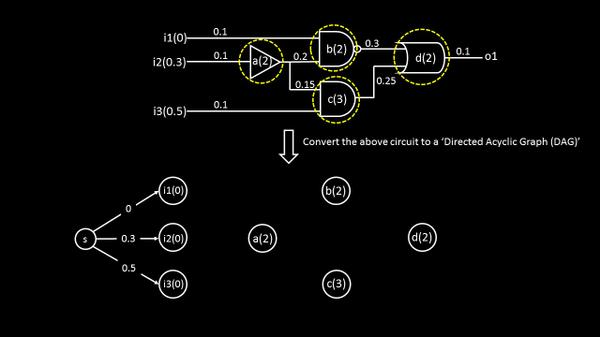
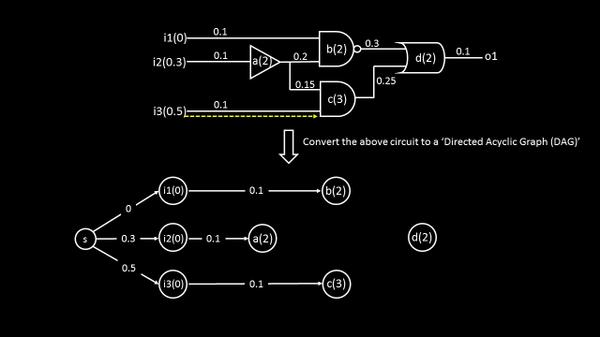
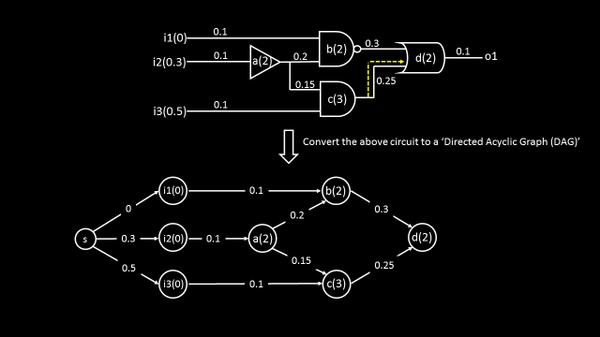
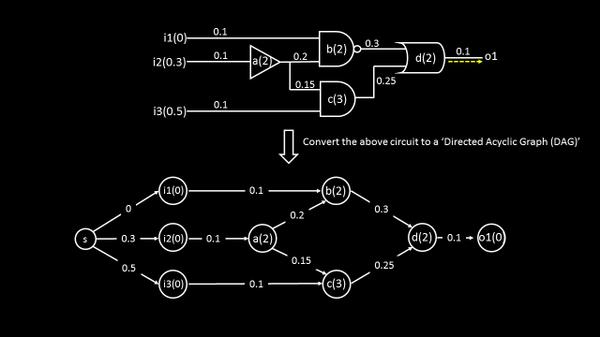
Above is called the ‘graph’. I still have to introduce ‘timing’ to it, to call this one as a ‘timing graph’. So we found out 30% of ‘timing graph’ hidden story and I can promise you that things become really
interesting when we discover the rest 70%.
If you are wondering from where did I get the above images, well, these are from my new (pre)launch course on ‘static timing analysis’ where, including above, I will be introducing you to such cool concepts of timing and make your journey memorable.
“You don’t learn to walk by following rules. You learn by doing, and falling over” – Richard Branson
That’s what I have been doing in all my courses/blogs and will continue doing
that.
And how I do it? Find it out below:
https://www.udemy.com/vlsi-academy-sta-checks/?couponCode=new_course_v3
Happy
Learning!!